|
$2.01M to $4.77M. Same brand, same dates, one year apart. It's one of Advertising Spire's many successful case studies:
| Sales |
$2,007,926 → $4,769,687 |
+138% |
| TACoS |
21.56% → 19.2% |
−2.36 pts |
| Ordered product sales |
$2.01M |
|
$4.77M |
| Previous 12 months |
|
Last 12 months |
|
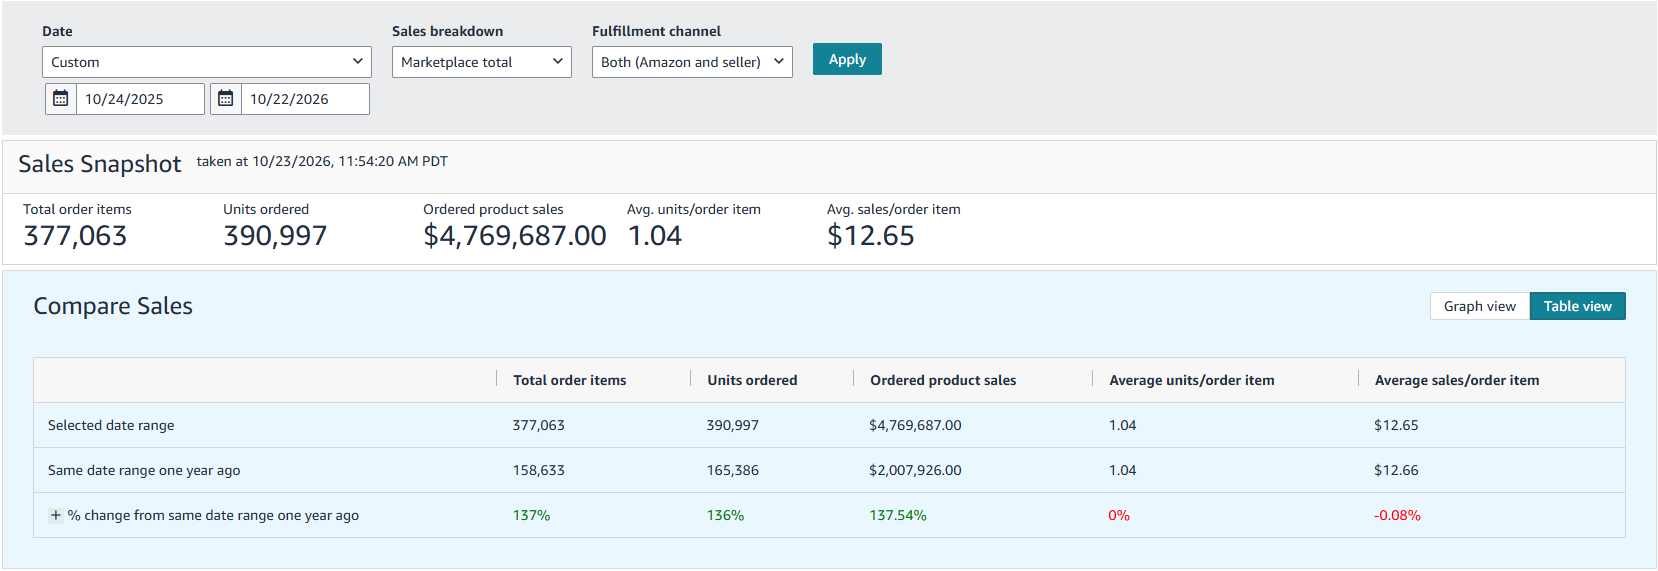
Oct 24, 2025 – Oct 22, 2026, vs the same dates a year earlier.
That's $2.76M in extra sales, and TACoS went down: sales grew faster than ad spend. Next stop is horizontal growth toward eight figures.
| Sound familiar? |
|
Sales gone flat |
|
Competitors outselling you, and you can't see how |
|
Launches that stall, and nobody can say why |
|
ACoS reports while profit slides |
|
| Get a free, tailored growth audit → |
What changed? Not the product. How the account was run:
|
One plan, not separate jobs. Ads, rankings, promotions and the listing moved together, planned hand in hand with the brand’s own supply chain and catalog teams. |
|
Buyers, not keywords. Spend followed who actually buys and what they search for, not a thousand generic keywords. |
|
Growth that pays for itself. Every dollar tied to a measurable goal. Spend only scaled when it hit the targets agreed with the brand up front. Hit them, scale. Miss them, find the root cause before another dollar goes in. That’s how sales outran ad spend and TACoS fell. |
And it's not a one-off. Same playbook, bigger brand:
|
Brand 2 · last 12 months
+77% sales
Sales: $5.67M → $10.03M
TACoS: 9.41% → 8.57%
|
$5.67M |
|
$10.03M |
| Prior 12 mo |
|
Last 12 mo |
|
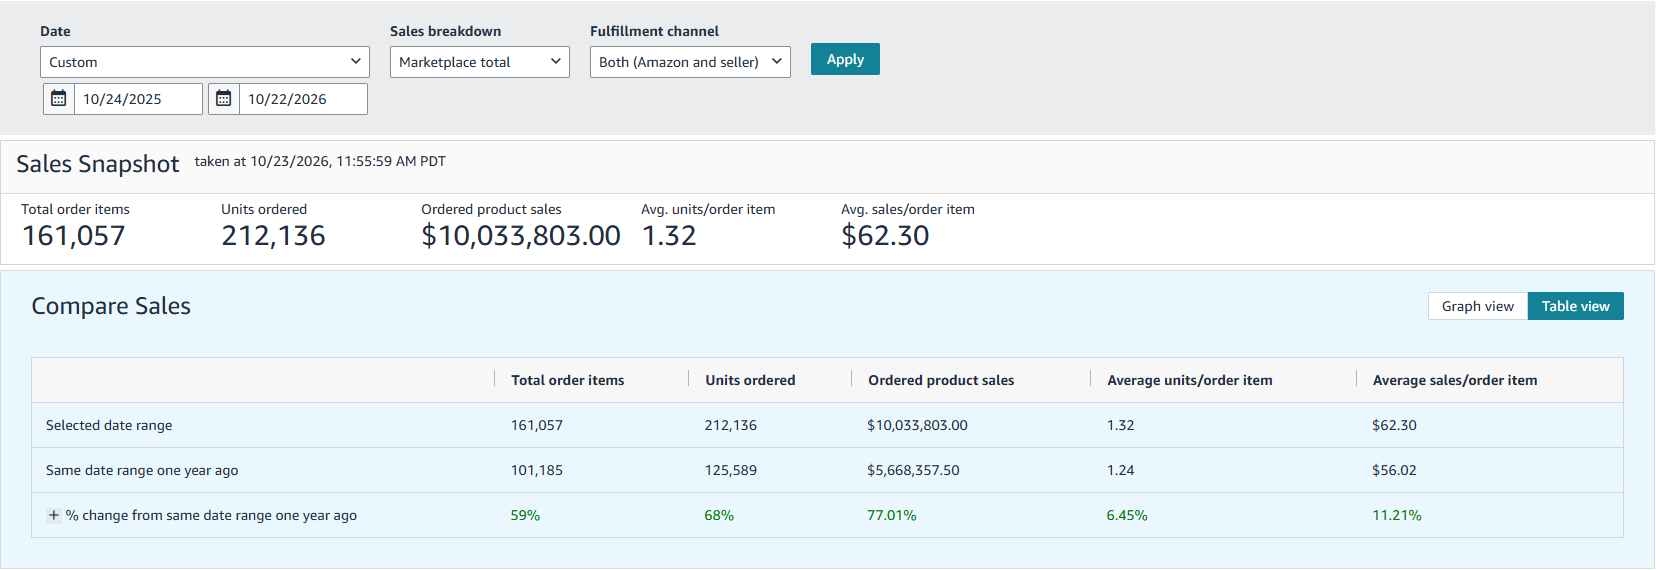
Brand 2: Oct 24, 2025 – Oct 22, 2026, vs the same dates a year earlier.
+$4.37M in extra sales, TACoS down again, and Brand 2 just crossed eight figures.
Every brand's ceiling is different. The audit shows you where yours is, and what's holding you below it.
What makes them different? Most agencies manage your ads and send an ACoS report. Advertising Spire works as an extension of your team, and the goal is profitable growth, not just better ad numbers:
| Budget |
Set by margin, CLTV and organic rank, not ACoS alone |
| Testing |
A/B tests on campaigns, images, titles and price |
| Launches |
Built to rank fast and reach profit sooner |
| Promos |
Deals timed to climb rank, without eating margin |
| Events |
Prime Day and BFCM planned for profit, not just a 3-4x spike |
| Inventory |
Ads synced with your supply chain: no stock-outs, no overstock |
| Every call judged on |
↻ CLTV buyers who come back |
|
▼ TACoS ads as a share of sales |
|
▲ Profit what you keep |
|
|
Selective by design
2-4
brands per manager. Nothing falls through the cracks.
|
|
Built, not rented
In-house
software that puts ads, rank, stock and profit in one view, so every decision is made for the whole business.
|
Here's the deal for BDSN readers:
|
Free, tailored growth audit: what's capping your growth and what to fix first. |
|
If it's a fit, they build your growth plan. No upfront payment. |
|
Not satisfied? You don't pay. |
Who it's for
$1M+/year brands. They're accepting 10 for a free growth audit, with room to onboard just 5 new partners. |
|
Kevin
P.S. Advertising Spire is an Amazon Ads Verified Partner. See more of their case studies. Even if you never hire them, the audit is yours to keep: claim yours here.
Questions first? Email the team at [email protected].
|
